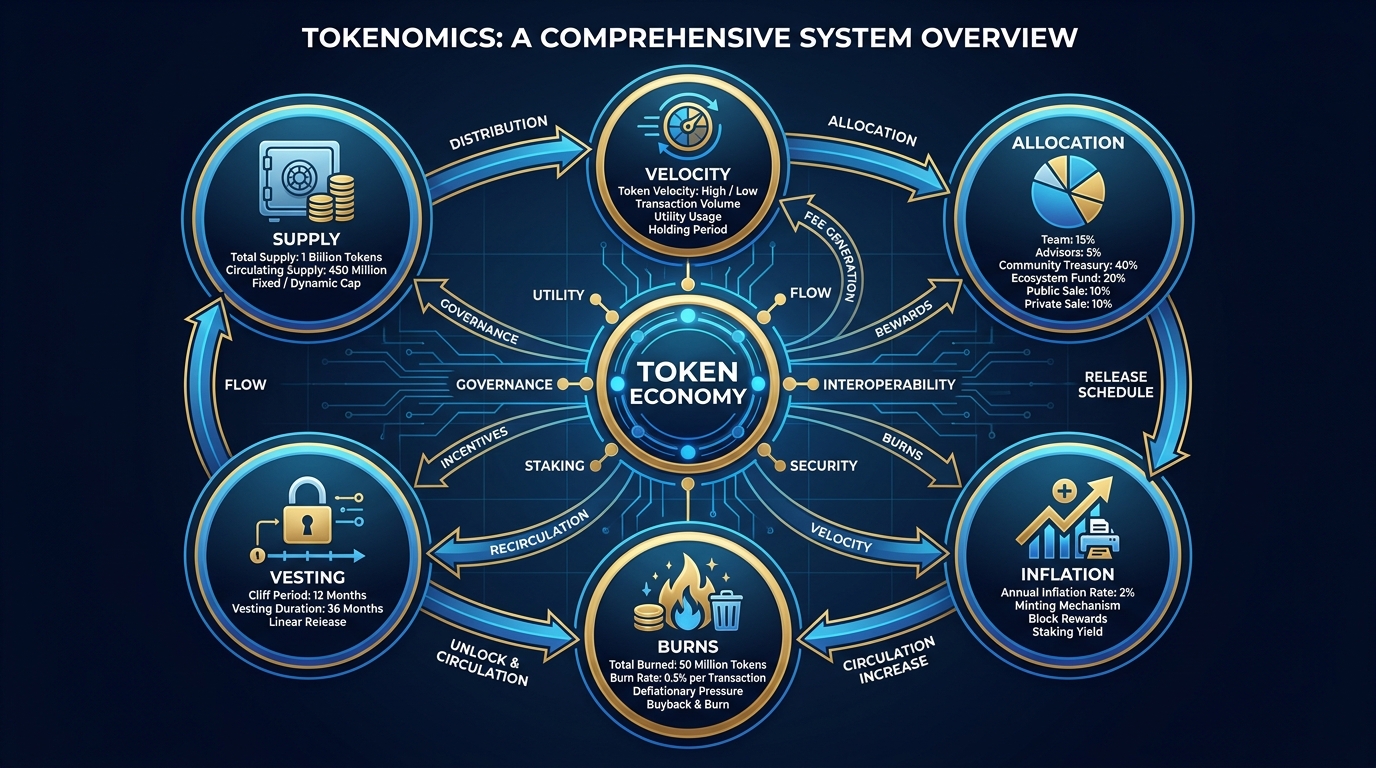
Figure 1:The full tokenomics system at a glance: supply mechanics, allocation pie, vesting schedule, and economic levers — all the variables that determine whether your token creates value or destroys it.
Every failed token has a beautiful whitepaper. The diagrams are polished. The metaphors are borrowed from Ethereum’s founding documents. The total addressable market is measured in trillions. And then, six months after launch, the price is down ninety percent and the founders have vanished.
Every successful token — every one — can be explained on a napkin. Not because the designers were lazy, but because simplicity is a feature. When you can draw your token economy in five minutes, it means the incentives are clear. And when incentives are clear, they are also checkable: anyone holding the asset can see whether the system is built to reward them or to extract from them.
This chapter is about that checkability. Tokenomics is incentive design — not marketing, not speculation, not vibes. You can model it in a spreadsheet before you risk a dollar. By the end of this chapter, you will have done exactly that.
1The Three Numbers Every Holder Asks First
Before a sophisticated investor reads a whitepaper, before they look at the team or the roadmap, they ask three numbers: total supply, circulating supply, and fully diluted valuation. If those three numbers do not make sense together, nothing else matters.
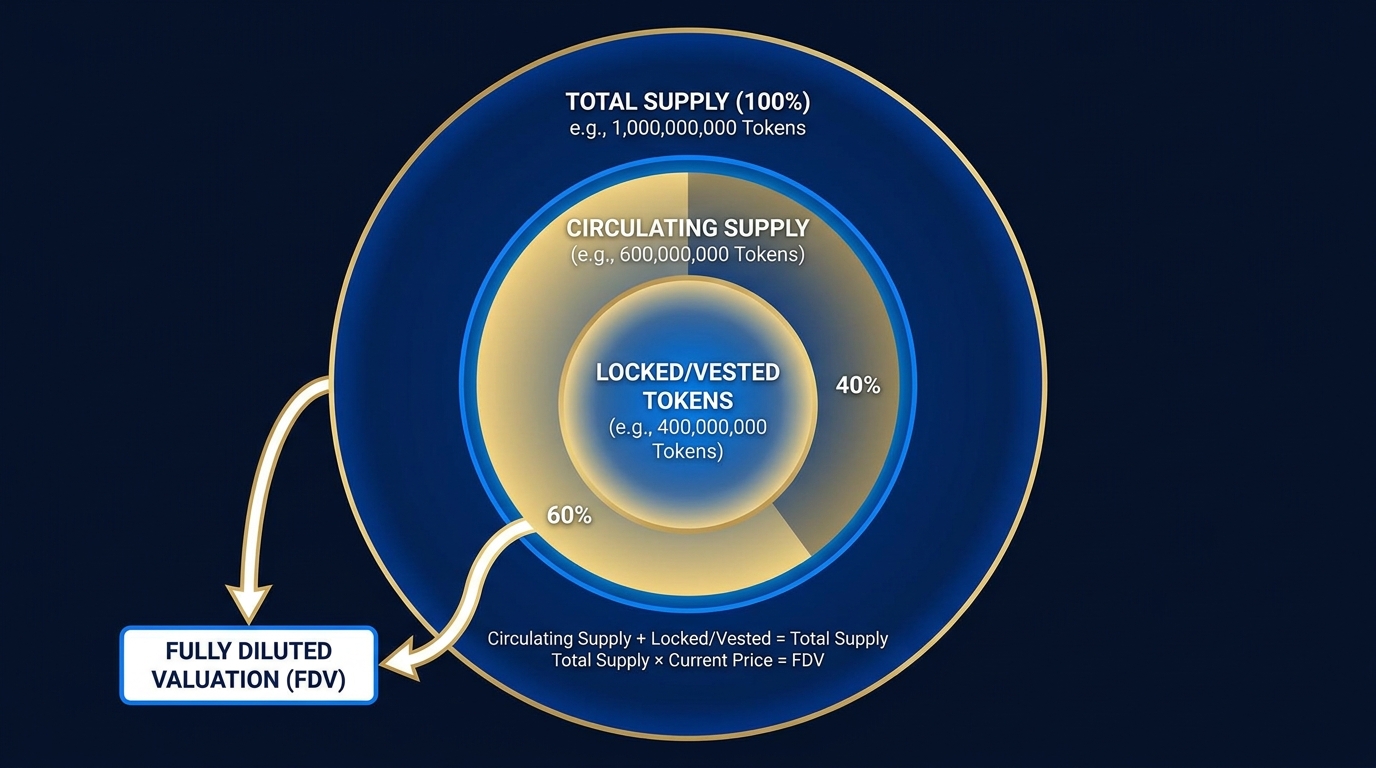
Figure 2:Total supply vs. circulating supply vs. fully diluted valuation — three numbers that tell three different stories about the same token.
Total supply is the maximum number of tokens that will ever exist. Think of it like authorized shares in a corporation — the ceiling written into the charter. For Solana’s SOL, the total supply grows modestly over time through staking rewards; for Bitcoin, it is hard-capped at twenty-one million. The number itself is not what matters — whether it is ten million or ten billion is irrelevant. What matters is the story it tells about scarcity and dilution.
Circulating supply is the number of tokens actually tradable on the open market today. This is where things get gamed. A project can claim a market capitalization of $500 million while ninety percent of tokens are still locked — meaning the real “fully diluted” value of the project, once all tokens unlock, is $5 billion. That gap is not illegal. But it is a pressure valve pointed at retail holders.
Here is the analogy that makes this concrete: imagine a startup that has issued ten million shares, but the founders and VCs hold nine million of them under lock-up agreements. The stock trades at $10 per share based on the one million shares in circulation. The market cap looks like $10 million. But the fully diluted market cap — what you are actually buying into — is $100 million. Every long-term investor knows to look at the diluted number. Token investors must do the same.
Fully diluted valuation (FDV) = price × total supply. This is the number that tells you what the market is pricing the entire project at, not just the liquid slice. When FDV is twenty times market cap, you are holding a token where supply will expand dramatically over the next few years. That is not automatically bad — it depends on whether the unlocked supply flows to users who create value, or to insiders who sell.
2The Allocation Table: Signal Before Intent
The allocation table is the single most revealing document in any token launch. It answers one question: who decided to give themselves how much?
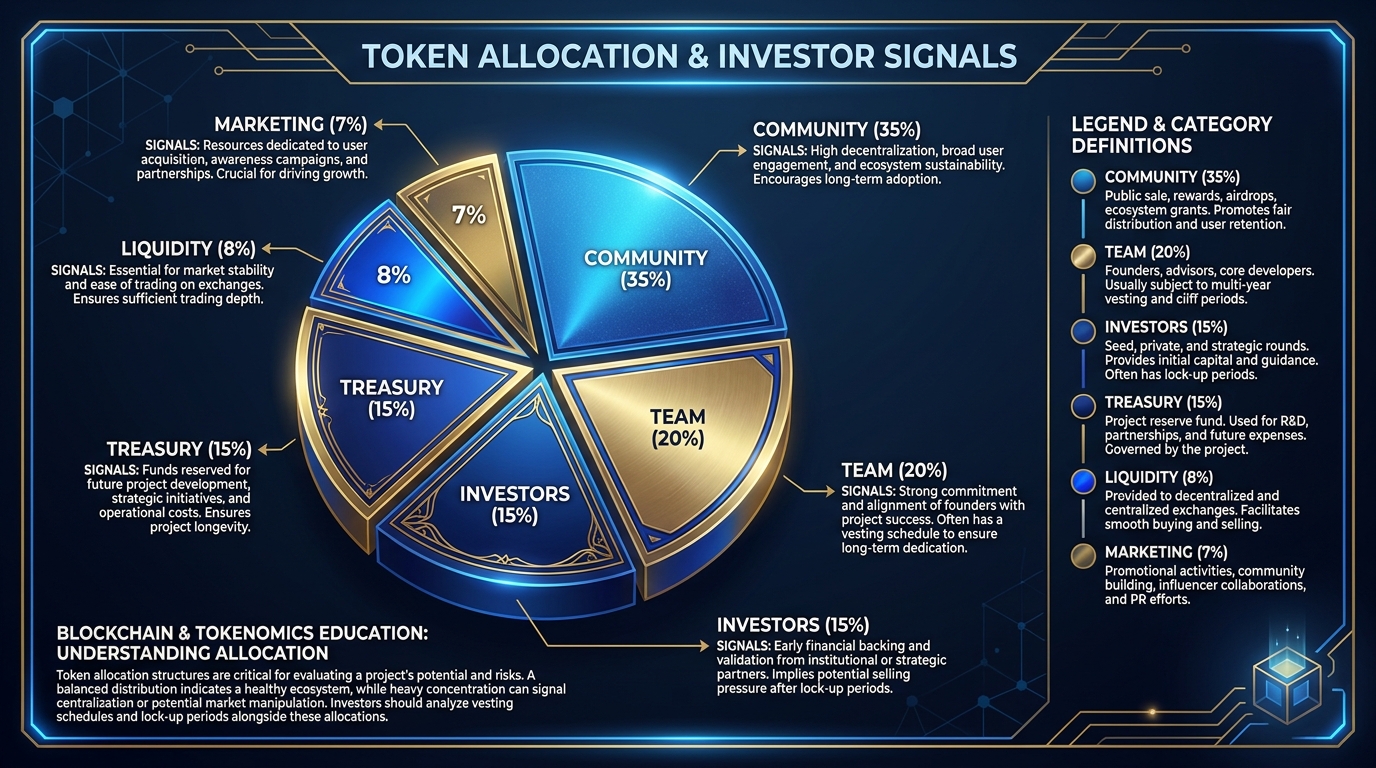
Figure 3:A token allocation table is a cap table — it reveals who has power, who was rewarded, and whether the people holding the asset were treated as partners or customers.
Here is a representative allocation for a mid-2020s Solana token launch, with annotations on what each category actually signals:
| Category | Typical Range | What It Signals |
|---|---|---|
| Team & Founders | 15–25% | Founder conviction; too high signals extraction risk |
| Investors (VCs, angels) | 10–20% | External validation; also future selling pressure |
| Community / Ecosystem | 25–40% | Commitment to decentralization; too high with no utility = inflation |
| Liquidity Pool | 5–15% | Depth of initial market; thin liquidity = high volatility |
| Marketing & Partnerships | 5–10% | Growth budget; often misused as insider compensation |
| Treasury / Reserve | 10–20% | Long-term runway; governance over this is critical |
The percentages alone tell you little. The story behind the percentages is what matters. A twenty percent team allocation that is fully vested over four years, with a one-year cliff, is dramatically safer for holders than a ten percent team allocation with no vesting at all. Speed matters more than size.
A community allocation of forty percent sounds generous — until you learn it is all distributed through “staking rewards” that pay existing holders, creating a system where people who already have tokens get more tokens. That is not community building. That is inflation dressed as charity.
3Vesting and Cliffs: Time as a Trust Mechanism
Vesting schedules are how you make promises credible. Without vesting, a team allocation is just a statement of intent — a moral commitment that costs nothing to break. With vesting, the team’s tokens are locked, and they literally cannot sell until specific conditions are met.
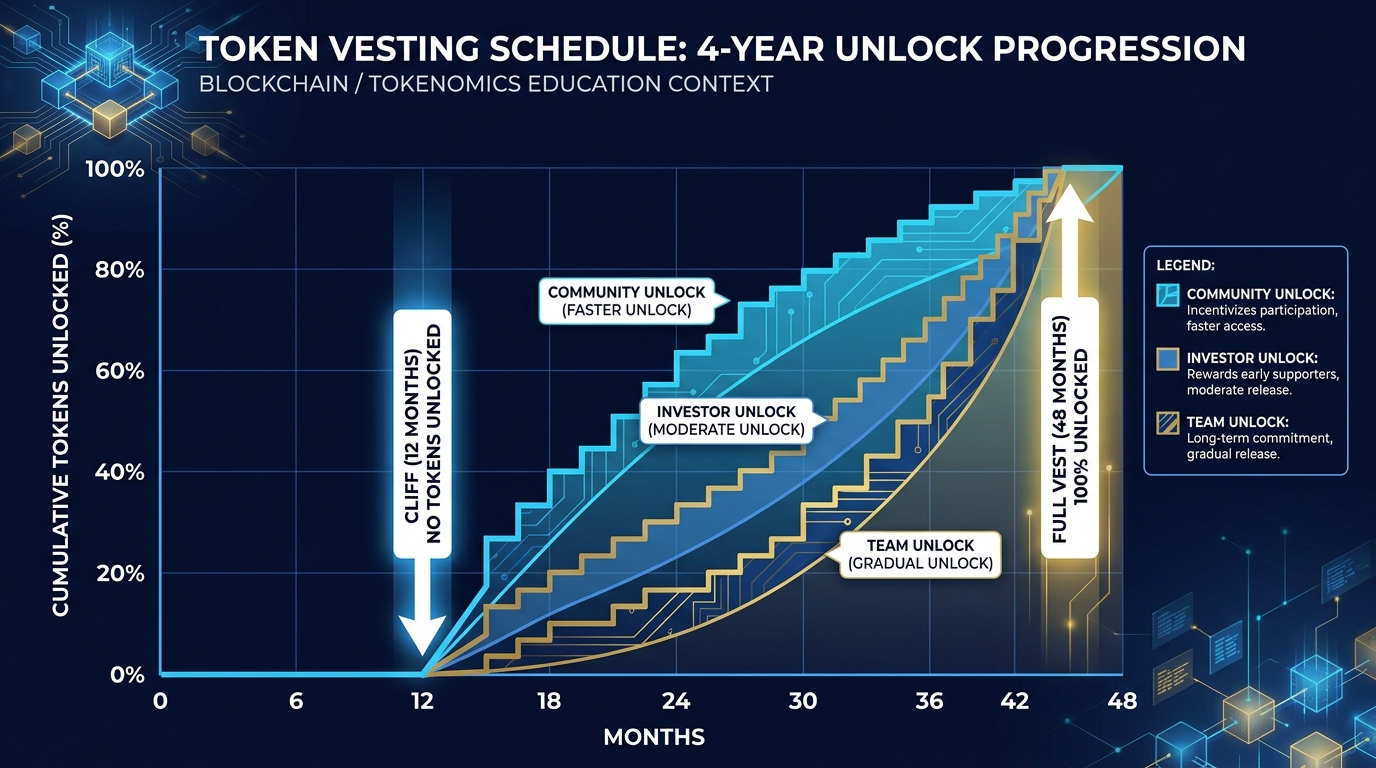
Figure 4:A four-year vesting schedule with a one-year cliff: tokens are locked entirely for the first twelve months, then unlock monthly over the following thirty-six months. This structure aligns founders with the long-term success of the project.
The standard Silicon Valley vesting schedule — borrowed directly from equity compensation — is four years with a one-year cliff. What this means in practice: if you are a founder and you leave the project in month eleven, you receive nothing. If you stay through month twelve, twenty-five percent of your allocation unlocks at once. Then, over the following thirty-six months, the remainder unlocks monthly (about 2.1% per month). This structure makes a founder’s short-term departure extremely costly — the cliff is a loyalty mechanism, not a punishment.
For tokens, this structure does something additional: it separates the founder’s incentives from the speculator’s incentives. A founder on a four-year vest cannot participate in a pump-and-dump. They are locked in. If the token is worthless in year four, so is their compensation. This alignment is the entire point.
When you are designing your own vesting schedule, ask three questions:
At what unlock event could an insider rationally exit and destroy the community’s trust? Design vesting to make that exit economically painful.
What is the circulating supply in months 1, 6, 12, and 24? Model each of these explicitly. Surprises in circulating supply are not surprises to the team — only to holders.
Who enforces the vesting? On Solana, token locks can be implemented programmatically using SPL token time-lock contracts — the lock is enforced by code, not by trust. This is dramatically safer than “we promise not to sell.”
4Inflation, Burns, and Buybacks: The Three Levers
Once your token is live, you have three primary tools for managing the relationship between supply and demand: inflation, burns, and buybacks. Understanding these is not optional — they are the mechanisms that determine whether your token economy is self-sustaining or slowly self-destructing.
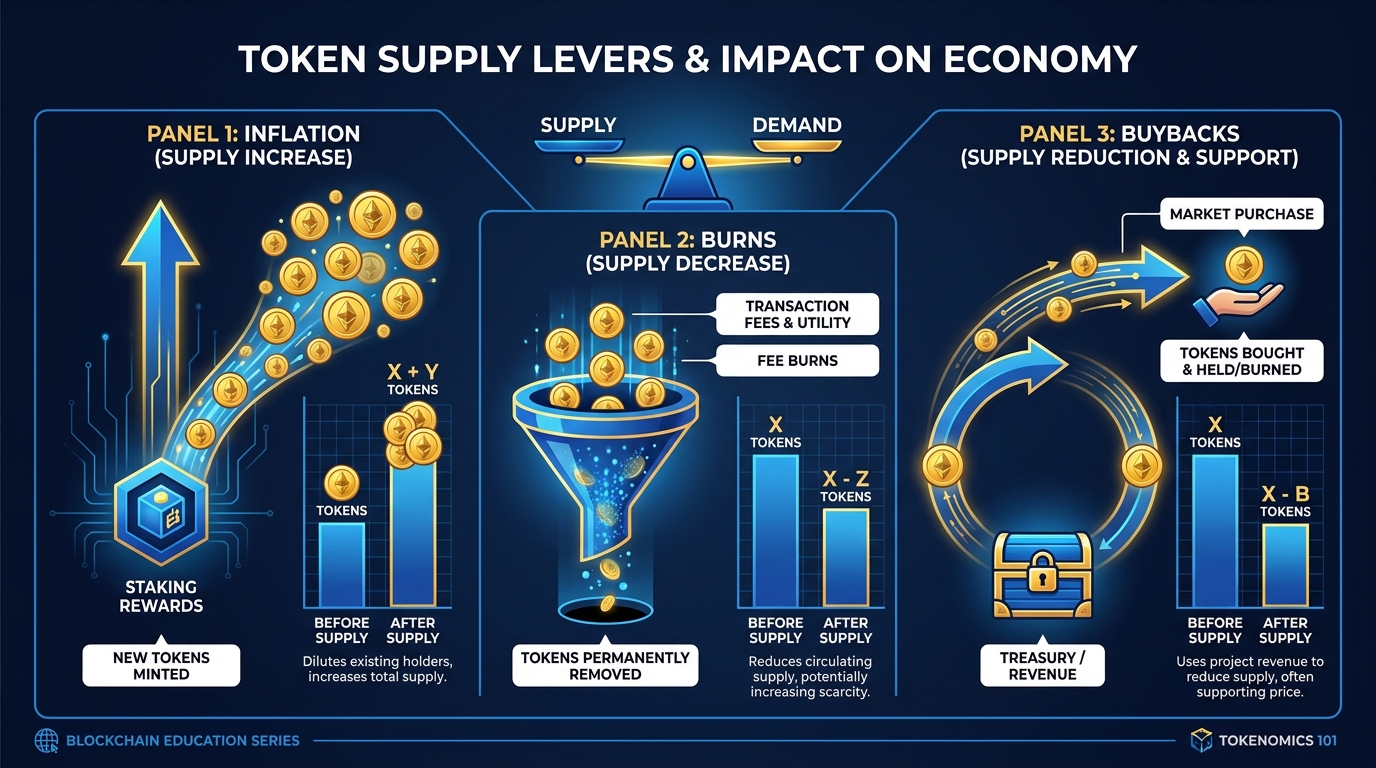
Figure 5:Inflation expands supply, burns reduce it, buybacks recycle it. Each lever creates different incentives and risks when combined with the wrong token utility model.
Inflation is the issuance of new tokens over time — typically to pay validators, stakers, or liquidity providers. Think of it as the central bank printing money to pay government employees. Done well, inflation funds the security and activity of the network. Done poorly, it destroys the purchasing power of every holder who does not actively participate in earning those new tokens. Solana’s native inflation started at eight percent annually at genesis and decreases by fifteen percent per year, targeting a long-run rate of 1.5%. This schedule was published in advance, is transparent, and is written into the protocol — holders know exactly what dilution to expect.
Burns remove tokens from circulation permanently. The analogy in corporate finance is a stock buyback followed by immediate cancellation — shares are removed from the float, reducing dilution. Ethereum’s EIP-1559 introduced a fee-burn mechanism where a portion of every transaction fee is burned. In the two years following its implementation, Ethereum burned over ten million ETH — permanently. The psychological effect is as important as the economic one: burns signal that the protocol views tokens as scarce and valuable, not as a tool for compensating insiders.
Buybacks use protocol revenue to purchase tokens from the open market, then either burn them or redistribute them to stakers. The corporate finance analog is a share buyback program: Microsoft spends its cash reserves buying its own stock, signaling confidence and supporting the price. For a token project, buybacks require genuine revenue — you cannot buy back what you cannot afford. Projects that promise “buyback and burn” without auditable on-chain revenue are making a marketing promise, not an economic commitment.
Worked Example: Modeling a Simple Token Economy
Suppose you launch a token with the following parameters:
Total supply: 100,000,000 tokens
Year-1 inflation: 5% (5,000,000 new tokens issued to stakers)
Year-1 fee burns: $200,000 in protocol fees, token price $0.10 = 2,000,000 tokens burned
Net supply change: +3,000,000 tokens (5M issued, 2M burned)
Effective inflation: 3%
Now suppose the protocol grows and year-2 fees triple:
Year-2 inflation: 5% (5,250,000 new tokens issued, since supply is now 103M)
Year-2 fee burns: $600,000 / $0.12 (new price) = 5,000,000 tokens burned
Net supply change: +250,000 tokens — nearly deflationary
This is the model every token designer should run. When does your protocol reach the inflection point where burn rate equals or exceeds issuance? That inflection point is often when token price begins its sustained upward trend.
5Velocity: The Hidden Killer
Here is the concept that separates professional token designers from amateur ones: velocity. It is also the most counterintuitive.
Velocity is the rate at which tokens change hands. In monetary economics, the equation of exchange is MV = PQ, where M is money supply, V is velocity, P is price level, and Q is the quantity of transactions. What this means in practice for tokens: if your token is spent immediately every time it is received — if no one holds it — the price will be low regardless of how many transactions occur on your network.
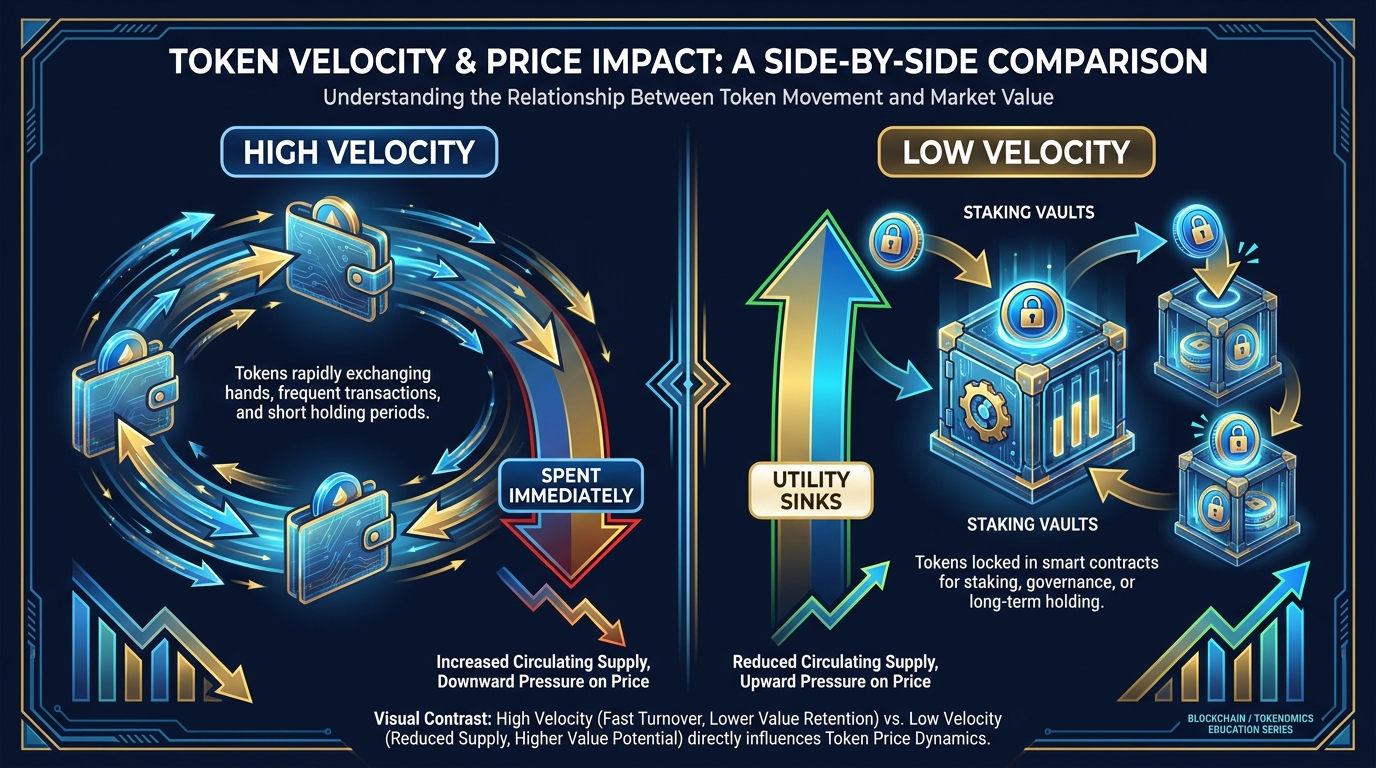
Figure 6:The velocity trap: tokens that serve purely as payment rails — spent immediately — create no incentive to hold, suppressing price even in a growing ecosystem. Utility sinks solve this.
Imagine a token whose only purpose is to pay for transaction fees on a platform. A user buys $10 worth of the token, uses it immediately, and the recipient sells it for $10 of stablecoins. The token touched two wallets for a combined holding time of maybe thirty seconds. High velocity, low price support.
Now compare a token that users must lock for thirty days to participate in governance votes, or stake to earn a share of protocol fees. Those tokens are removed from circulating supply. Their velocity drops to near zero. Demand stays constant, but effective supply shrinks — price rises.
The design lesson: every successful token economy has utility sinks — mechanisms that remove tokens from circulation by making holding valuable. The most common sinks are:
Staking — lock tokens to earn yield or network rewards
Governance — lock tokens to vote on protocol decisions
Premium features — hold a minimum balance to access certain functionality
Fee discounts — hold tokens to reduce platform fees (Binance BNB model)
Collateral — post tokens as collateral to access loans or derivatives (how lending markets do this: Chapter 5, Beyond the Pool)
The depth and quality of your utility sinks determine whether your token has genuine demand or merely transient activity.
6The Other Side of the Napkin: Demand
Everything in this chapter so far — supply, allocation, vesting, unlocks — describes one curve. Supply curves without demand curves produce no price. The napkin has a second side, and it can be modeled with the same arithmetic.
The minimum demand model. Estimate expected users per month, multiply by the tokens each must hold — pull the tier thresholds from Chapter 7’s table (100 tokens for Explorer, 500 for Builder, 2,000 for Architect, 10,000 for Founder) — and multiply by the average holding period. That product is tokens locked in sinks. Add tokens consumed (burned) per month. Using the worked example above: if the protocol’s $200,000 in year-1 fees burns 2,000,000 tokens at $0.10, that is roughly 167,000 tokens consumed per month; if 1,000 users each hold an average of 500 tokens to keep a tier, another 500,000 tokens sit locked in the status sink.
The implied price band. Compare tokens demanded in sinks against circulating supply from your Step 3 projection. When sink demand exceeds the circulating float, price pressure is upward — buyers must bid tokens away from holders who have reasons not to sell. When unlocks exceed sink growth, pressure is downward — new supply arrives faster than new reasons to hold it.
The inflection. The month where monthly burns + newly locked tokens ≥ monthly unlocks + emissions is the month your token economy stops leaking. Run it on the worked example: year 1 issues 5,000,000 tokens to stakers (≈ 417,000/month) against ≈ 167,000/month burned — supply wins, pressure is downward. By year 2, burns reach 5,000,000 against 5,250,000 issued (≈ 437,500 vs. ≈ 417,000 per month) — burns nearly match emissions, and any locked-sink growth on top tips the balance. That crossover is the inflection point the worked example identified; the demand model tells you when it arrives, not just whether.
One honest caveat. This is a napkin, not a valuation. It tells you whether the design is coherent — whether demand mechanisms could plausibly absorb the supply schedule you built — not what the price will be. A coherent design can still fail; an incoherent one is guaranteed to.
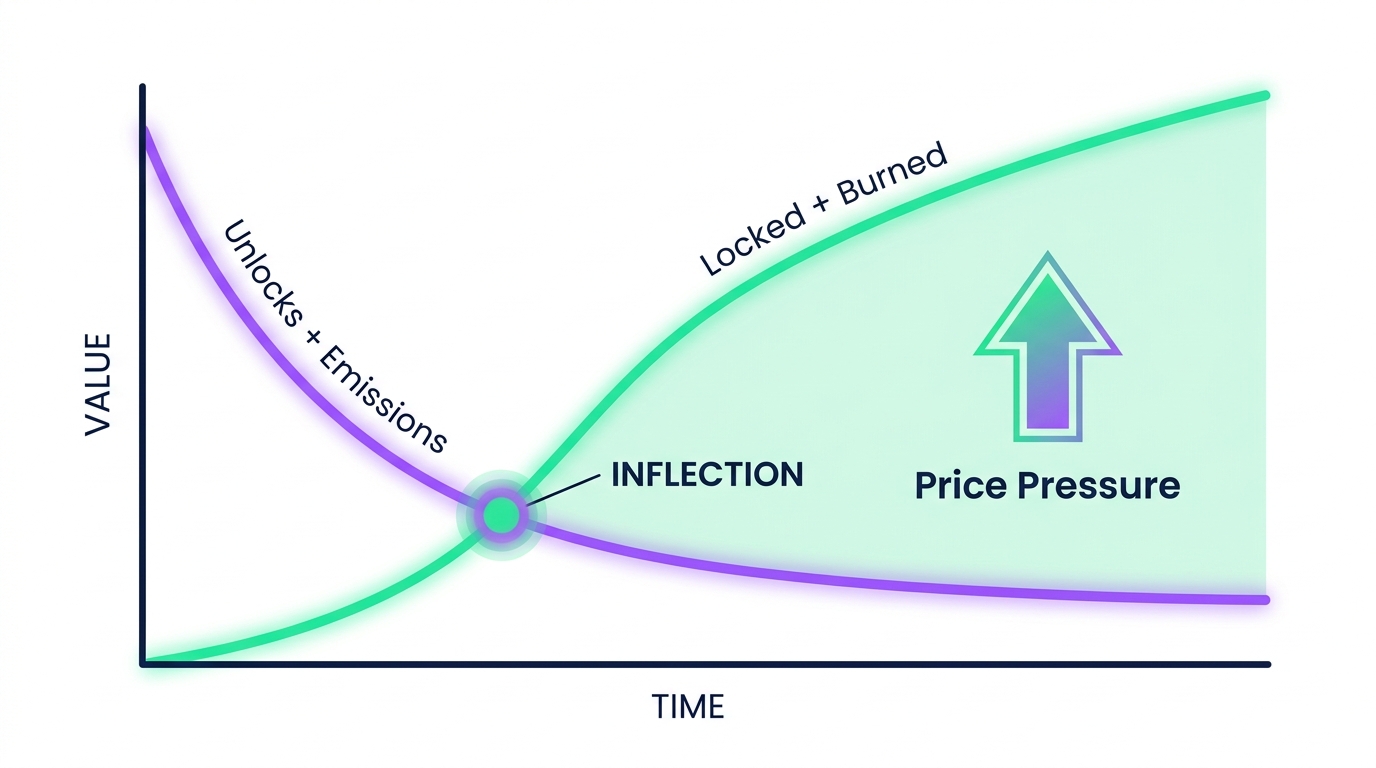
Figure 7:The inflection point: the month where monthly burns plus newly locked tokens meet or exceed monthly unlocks plus emissions. Before it, supply pressure dominates; after it, demand mechanisms absorb the float.
7Reading a Tokenomics Table Like an Investor
Sophisticated investors run through a mental checklist when evaluating any new token. Here is that checklist, made explicit.
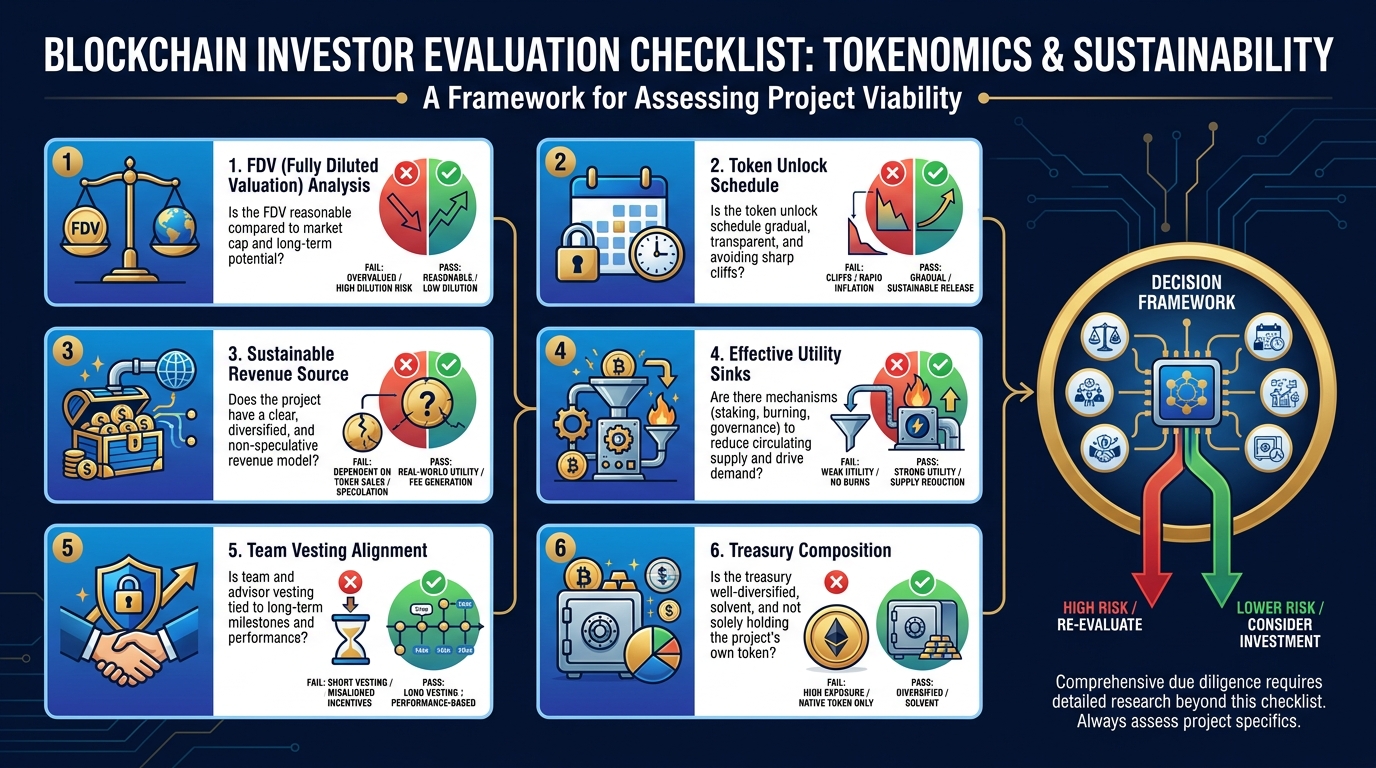
Figure 8:The six-question tokenomics checklist: every question an investor asks before committing capital to a new token project.
Question 1: What is the FDV at launch? Divide total supply by circulating supply to get the unlock multiplier. If FDV is $1 billion and market cap is $50 million, you are buying into a project that requires twenty-times price appreciation just to hold value after full dilution. That is possible — but it needs to be priced in.
Question 2: Who unlocks first, and when? Map the unlock schedule month by month for the first twenty-four months. Identify any events where more than five percent of total supply unlocks in a single month — these are selling-pressure landmines.
Question 3: Is there an auditable revenue source for burns/buybacks? Any promise of “buy and burn” must be backed by on-chain, auditable revenue. Ask for the dashboard. If there is no dashboard, there is no revenue.
Question 4: What are the utility sinks? Can you name three mechanisms that create real demand to hold — not just to speculate? Staking yields paid in the same token are circular (they create inflation, not genuine demand). The best sinks create demand from outside the token ecosystem — fees paid in the token by users who would not otherwise hold it.
Question 5: Does the team’s vesting align with the project’s stated runway? A project claiming a five-year roadmap whose founders fully vest in eighteen months is misaligned. The team should be locked in at least as long as they are asking investors to be locked in.
Question 6: What happens to the treasury in a bear market? The treasury exists to fund development when token price falls. If the treasury is held entirely in the project’s own token, it is worth nothing during the periods when it is needed most. Best-practice treasuries hold fifty to seventy percent in stablecoins or blue-chip assets.
8Common Failure Patterns
The token graveyard is vast. The same mistakes appear so consistently that they have earned names.
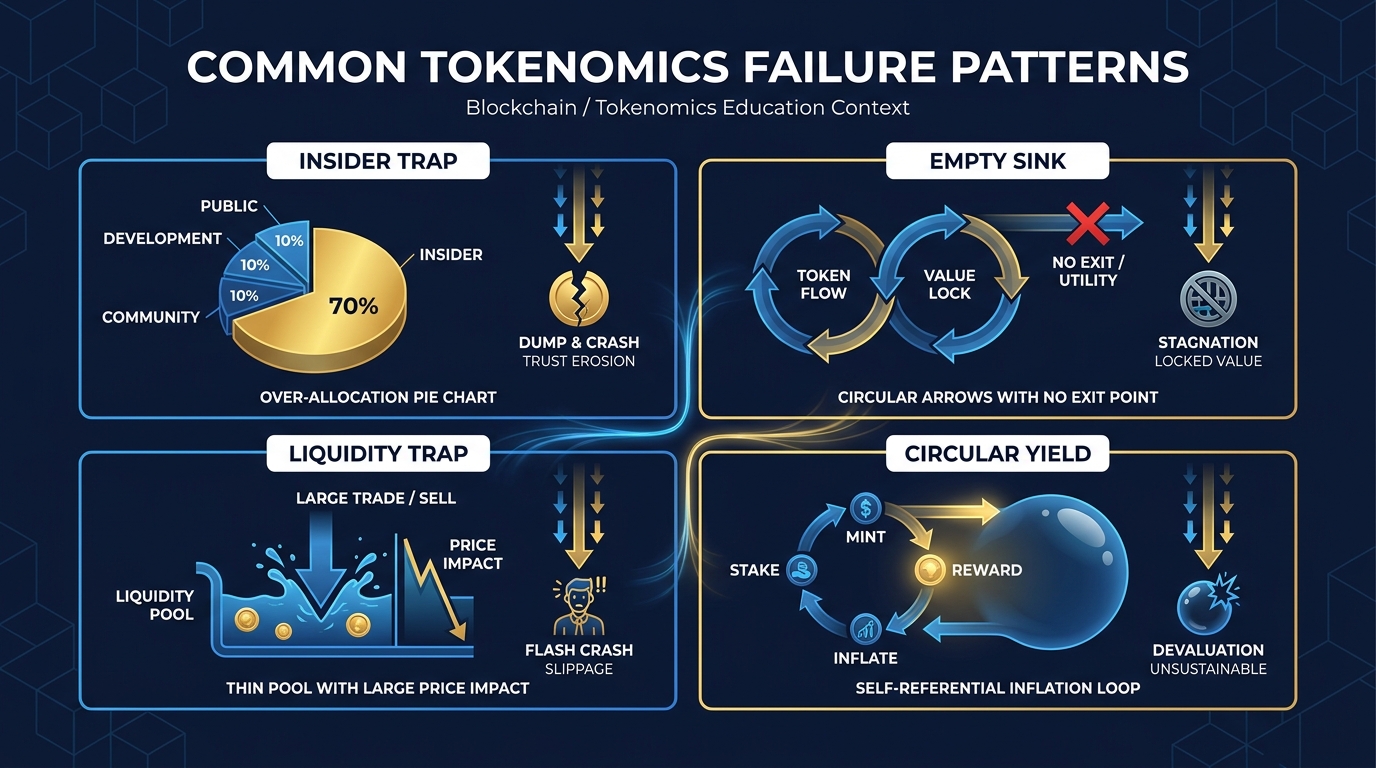
Figure 9:The four most common tokenomics failure patterns — each one a design decision that seemed reasonable at inception and became catastrophic at scale.
The Insider Trap: Team + investor allocation exceeds fifty percent of total supply. Even with vesting, this creates a structural ceiling on decentralization. The community has no meaningful governance power, and every unlock event is a potential exit. The fix is simple: keep combined insider allocation below thirty-five percent, with vesting no shorter than three years.
The Empty Sink: The project has a token with no genuine utility sink. Staking rewards are paid in the same token (circular), governance exists but no decisions are ever made (ceremonial), and the only real demand driver is speculation. When speculation cools, there is nothing underneath. The fix: at least one utility sink must create demand from users paying for something they genuinely want — not just from other token holders recycling tokens to each other.
The Liquidity Trap: The initial liquidity pool is too thin relative to market cap. Even a small sell order moves the price significantly. Sophisticated traders exploit this by buying into artificial scarcity, then selling as soon as the project attracts retail attention. The fix: liquidity pool allocation should be large enough that a single trade cannot move the price more than two to three percent. A rough rule is to seed liquidity equal to three to five percent of total supply at launch price.
The Circular Yield: The project advertises “high APY staking rewards” — sometimes hundreds of percent annually. These yields are paid in new tokens. To sustain the APY, new tokens must be printed. Printing new tokens dilutes existing holders. To maintain token price, new buyers must enter faster than existing holders are diluted. When new buyer flow slows, the system collapses. This is not a bug — it is the structural logic of any Ponzi scheme applied to tokens. The tell: if the advertised yield exceeds the project’s actual revenue yield by more than five-to-one, the extra yield is being funded by dilution, not by real economic activity. Chapter 5’s Real Yield vs. Emissions Yield gives the mechanism and a test you can run on any advertised APY.
9🛠 Activity: Model Three Futures
This is the core practical exercise of the chapter. You will build a simple tokenomics spreadsheet for your own token — or for the hypothetical “LabToken” if you have not yet designed one — and model three distinct futures.
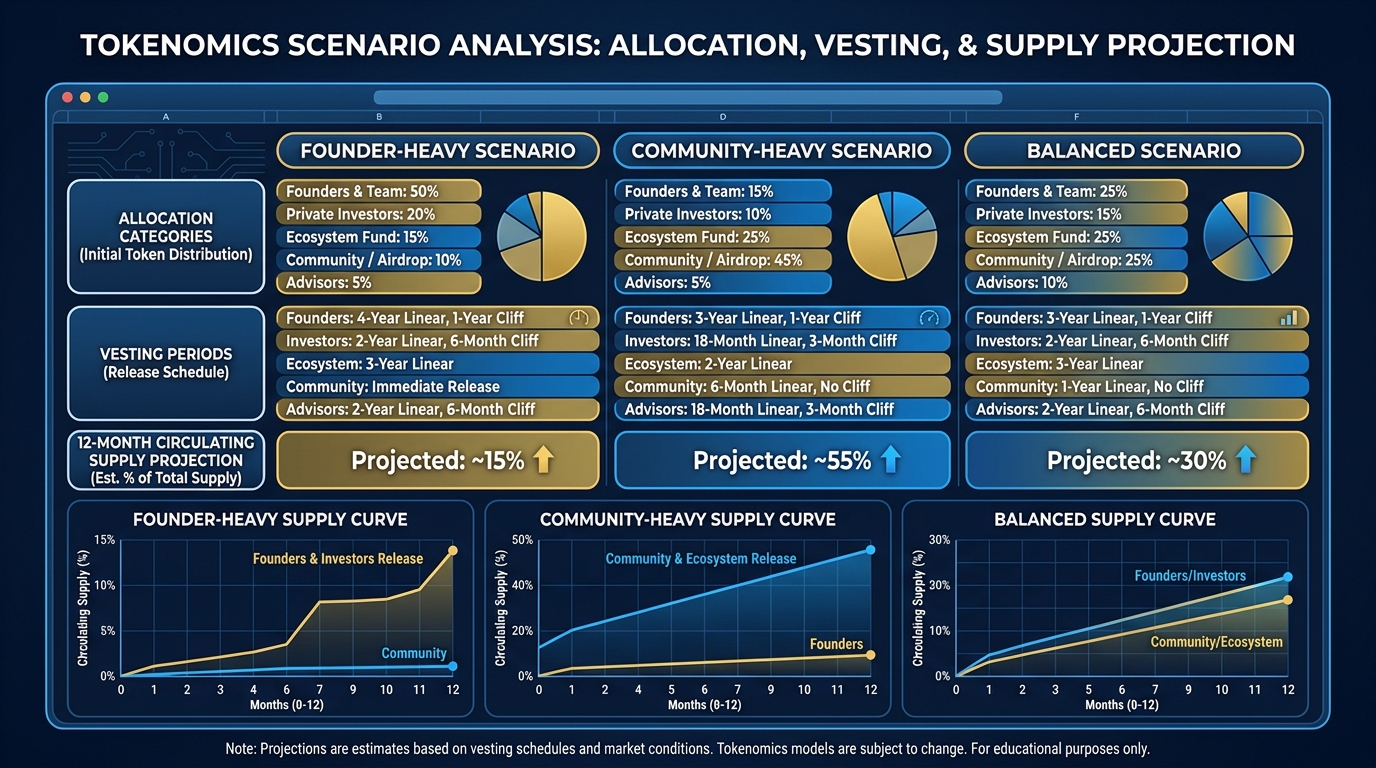
Figure 10:The three-scenario tokenomics model: each column represents a different allocation philosophy, with resulting circulating supply curves that tell very different stories to investors.
Step 1: Define your total supply. Pick a number between one million and one billion. Larger numbers are not inherently better — they are just harder to track. One hundred million is a reasonable, round starting point.
Step 2: Build three allocation scenarios.
| Category | Allocation |
|---|---|
| Team & Founders | 35% |
| Investors | 20% |
| Community | 20% |
| Liquidity Pool | 5% |
| Marketing | 5% |
| Treasury | 15% |
Vesting: Team vests over 2 years with 6-month cliff (fast). Investors vest over 18 months (very fast).
First-year unlock: ~62% of total supply in circulation by month 12.
| Category | Allocation |
|---|---|
| Team & Founders | 10% |
| Investors | 8% |
| Community | 50% |
| Liquidity Pool | 12% |
| Marketing | 5% |
| Treasury | 15% |
Vesting: Team vests over 4 years with 1-year cliff. Investors vest over 3 years. Community distributed via airdrops and staking over 5 years.
First-year unlock: ~28% of total supply in circulation by month 12.
| Category | Allocation |
|---|---|
| Team & Founders | 20% |
| Investors | 12% |
| Community | 35% |
| Liquidity Pool | 8% |
| Marketing | 5% |
| Treasury | 20% |
Vesting: Team vests over 4 years with 1-year cliff. Investors vest over 2.5 years. Community distributed over 4 years via multiple mechanisms.
First-year unlock: ~38% of total supply in circulation by month 12.
Step 3: Build a 12-month circulating supply projection. For each scenario, create a table with twelve rows (one per month). For each category, calculate how many tokens unlock per month based on the vesting schedule. Sum the unlocks to get total circulating supply. Calculate circulating supply as a percentage of total supply.
Step 4: Choose one scenario and write a one-paragraph investor justification.
Your justification should answer: Why does this allocation serve long-term token holders? Why is it fair to all stakeholders? What mechanisms prevent insiders from extracting value at the community’s expense? Write it as if you are presenting to an investor who has seen a thousand token launches and is looking for any reason to say no.
Step 5: Add the demand column. For your chosen scenario, estimate users at months 1, 6, and 12 (three numbers). Multiply each by the Chapter 7 tier requirement your typical user targets (e.g., 500 tokens for Builder) to get tokens locked in sinks. Add estimated monthly burns. Compare against that month’s unlocks from your Step 3 projection and mark the inflection month — the first month where burns + newly locked tokens ≥ unlocks + emissions. If there is no inflection within 12 months, note that, and write one sentence on what you would change (slower vesting, deeper sinks, or a burn mechanism) to create one.
10💬 Discussion: The Builder’s Dilemma
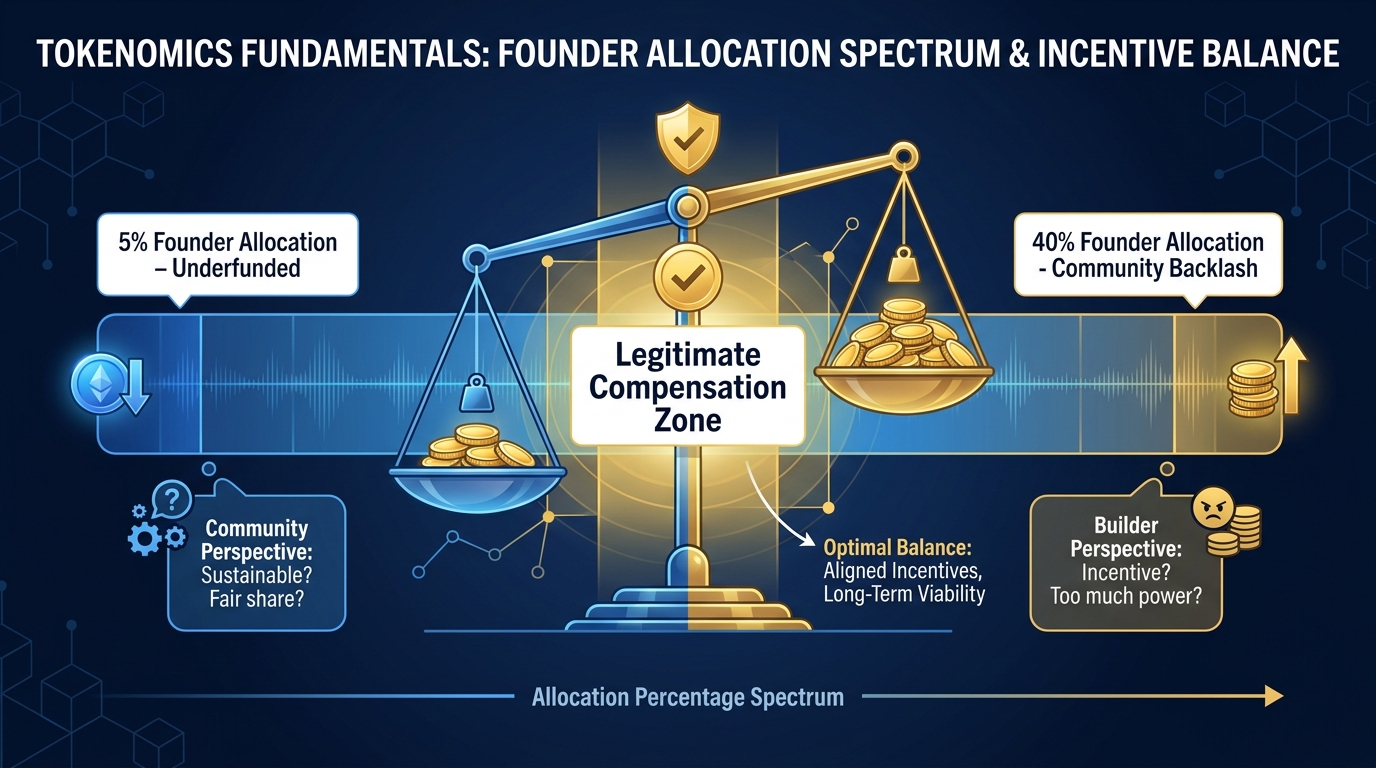
Figure 11:The builder’s dilemma: every founder must walk the line between compensating themselves enough to build something real and allocating so much that holders feel exploited.
If you allocate forty percent of your token to yourself and vest it over four years, holders may still call it a “rug” — even though you honored the vesting schedule and built exactly what you promised. The perception of extraction is powerful enough to kill projects even when no actual misconduct occurred.
If you allocate five percent to yourself, you may not have enough to fund development, hire collaborators, or weather a bear market without selling. Projects fail from underfunding as surely as they fail from insider extraction.
Where is the line between rewarding the builder and exploiting the community — and who gets to draw it?
Consider these dimensions in your discussion:
Who bears the risk? Founders often work for years before a token launch with no guaranteed return. Does that early risk justify a larger allocation?
Who has the information advantage? Founders know the project’s real status better than any holder. Does that information asymmetry change the ethics of their compensation?
What does the market say? Token markets are transparent — allocation tables are public. If the market accepts a high founder allocation and the price holds, has the community voted with its capital?
Is vesting sufficient? A four-year vest aligns financial incentives but not values. A founder can build exactly what was promised, vest fully, sell everything, and walk away — leaving holders with a technically functional but abandoned protocol.
Discussion Guidelines:
Include at least one scholarly or credible citation in your main response (academic paper, industry report, or documented case study of a specific token launch). Respond to at least two peers with substantive engagement — not just agreement, but pushing on the assumptions behind their position.
11🎯 In-Class Assignment: Design Your Allocation Table (10 pts)
Details and instructions will be provided in class.
Points: 10
12Walk Away With
By the end of this chapter, you have three concrete deliverables:
An allocation table — the percentage breakdown of your token across all stakeholder categories, defensible in a one-paragraph investor pitch
A vesting schedule — month-by-month unlock events for each category, with cliff dates and linear or monthly unlock cadence specified
A 12-month circulating supply projection — a table showing exactly how many tokens are in circulation each month, expressed as both a raw number and a percentage of total supply
These three documents together constitute a tokenomics brief — the minimum viable economic documentation for any serious token launch. They will not prevent you from making mistakes. But they will make your mistakes legible, which means they will also be fixable.
13Glossary
Total Supply The maximum number of tokens that will ever exist for a given project. Analogous to authorized shares in a corporation. May or may not equal circulating supply at any given time.
Circulating Supply The number of tokens currently available for trading on open markets. Excludes tokens held in lock-up agreements, vesting contracts, or project treasury wallets.
Fully Diluted Valuation (FDV) The hypothetical market capitalization of a project if all tokens — including locked and unvested tokens — were in circulation today. Calculated as: current price × total supply.
Vesting Schedule A predetermined timeline governing when allocated tokens become available to their recipients. Standard schedules run 36–48 months with a 12-month cliff.
Cliff The initial period in a vesting schedule during which no tokens unlock. If a recipient leaves the project before the cliff date, they receive nothing. Typical cliff: 12 months.
Token Allocation The percentage of total token supply designated for each stakeholder category (team, investors, community, etc.). The allocation table is the primary governance document of a token economy.
Inflation (Token) The issuance of new tokens over time, typically to pay validators, stakers, or liquidity providers. Dilutes existing holders unless offset by demand growth or burns.
Token Burn The permanent removal of tokens from circulation by sending them to an address from which they cannot be recovered. Reduces total and circulating supply, creating deflationary pressure.
Buyback The use of protocol revenue to purchase tokens on the open market. May be followed by a burn (buyback-and-burn) or redistribution to stakers.
Velocity (Token) The rate at which tokens change hands. High velocity suppresses price even in a growing ecosystem; low velocity (achieved through utility sinks) supports price appreciation.
Utility Sink Any mechanism that removes tokens from active circulation by making holding them economically rewarding — staking, governance participation, fee discounts, collateral posting.
Liquidity Pool A pair of assets locked in a decentralized exchange smart contract to facilitate trading. Thin liquidity pools amplify price volatility; deep pools stabilize it.
Insider Allocation The combined percentage of tokens held by team members, founders, advisors, and early investors — any party with information or influence advantages over public holders.
Circular Yield A staking model in which yield is paid in the same token being staked, creating inflation that dilutes the value of the yield being earned. Sustainable only if external demand growth exceeds dilution.
Treasury The project’s reserve of tokens or stable assets, controlled by the founding team or governance, used to fund ongoing development and operations. Best-practice treasuries hold a meaningful portion in stablecoins.
Unlock Event A specific date or milestone on which a tranche of vested tokens becomes available to their recipients. Large unlock events represent potential selling pressure and are closely watched by the market.